Debugging scripts with Visual Studio Code
Visual Studio Code
Visual Studio Code is a source-code editor made by Microsoft for Windows, Linux and macOS.
Features include the support for debugging, syntax highlighting, intelligent code completion, snippets, code refactoring, and embedded Git.
VS Code can be downloaded from the official website:
Recommended VS Code extensions
- Python (Pylance included) - a must-have extension that includes features such as IntelliSense (Pylance), linting, debugging, code navigation, code formatting, refactoring, variable explorer, test explorer, and more.
- Code Spell Checker - a must-have basic spell checker.
- autoDocstring - Python Docstring Generator - to quickly generate docstrings for python functions and classes.
- Indent-Rainbow - a simple extension to make indentation more readable.
- Python Indent - corrects Python indentation.
Configure the debugger
1. Configure FASTSUITE Edition 2
| 1.1 | Search for the file cenpyinit.py in the root folder of FASTSUITE and open it in a editor. |
| 1.2 | Enable the debugging by setting the flag: enablePythonDebug = True |
2. Configure Visual Studio Code
2.1. Make sure that Visual Studio Code has been installed properly
2.2. Run Visual Studio Code. Verify that the Python extension has been installed. The extension can be found here:
 2.3
2.3- Configure the
 2.4
2.4- Open the
 2.5
2.5- IntelliSense settings
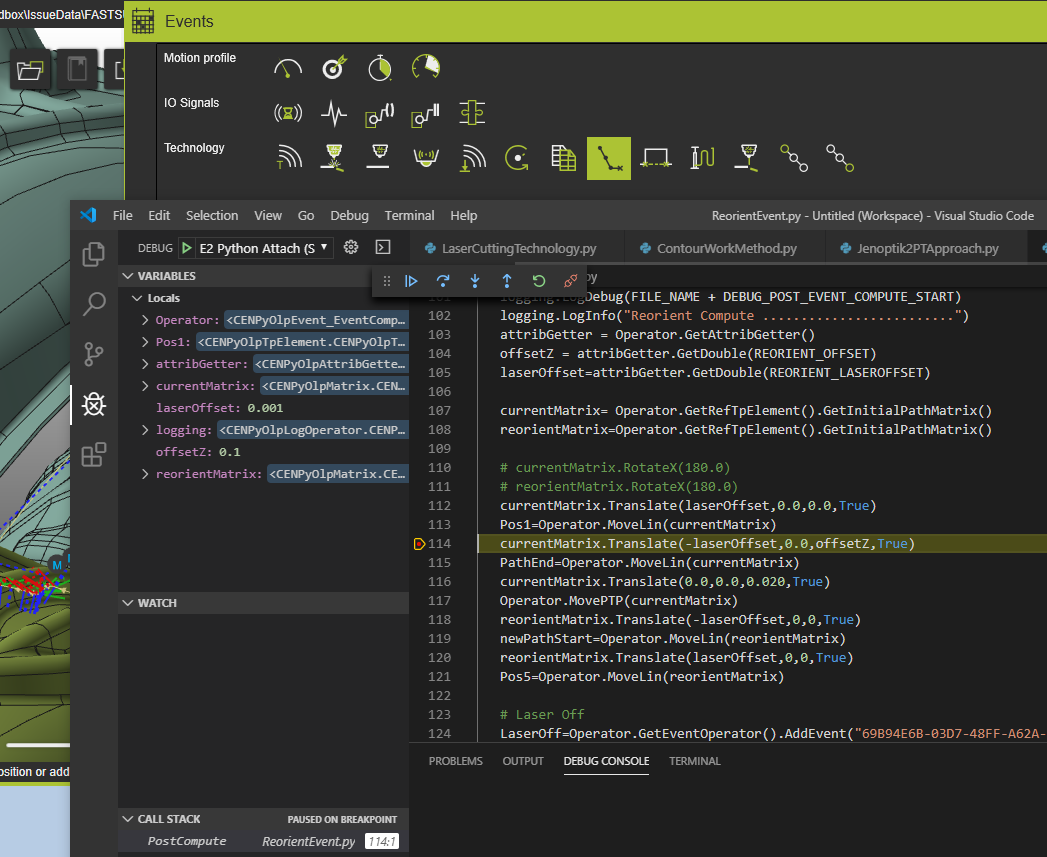
3. Debugging
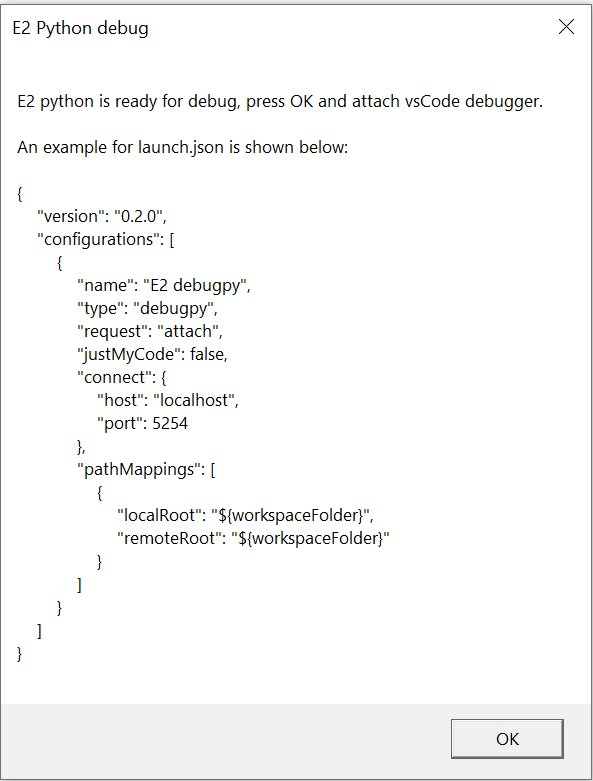
Note: See the debug configuration screenshot below.
Was this page helpful?